

 To kick off the new year, Focus has announced a new partnership with Splunk. It is an interesting and very special technology. Splunk has the capability to do many things within an organization, but boiling it down to its most basic form, splunk adds value by helping to make sense out of any systems machine data. For even greater value, Splunk delivers the ability to correlate and visualize the data.
When you hear big data you often think Hadoop. Hadoop can be a considerable expense for organizations. It usually requires infrastructure to support the worker nodes and data lake. It also normally requires an application developer, data scientists, and data analysts. This can be a show stopper for many companies. In my opinion Splunk seems to fit right in between doing nothing with big data analytics and Hadoop. Using Splunk instead of Hadoop can be a considerably less expensive endevor, making it more affordable to perform big data analytics.
What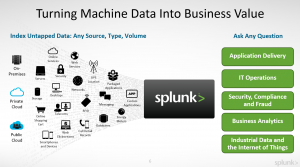 is Splunk?

It’s not often that IT guys get to use their imagination or ask a product to do something. Typically an IT product is designed for a specific purpose. We use VMware View to do VDI, Microsoft Exchange for email, or Microsoft SQL Server to host databases. That’s not necessarily the case with Splunk. Seemingly, one of the toughtest things to do with Splunk is figure out what you want to get out of it. That should start before you even download the software. Splunk is capable of mining any data you can send it, from structured databases to RFID key card entry system logs. As a basic example, if you wanted to create a dashboard that showed how long the time was between when a user badges into the building and when they login to their desktop, you can get that data. That’s more of a data analyitcs situation. However, Splunk can also do things with IT operations as well. Things like reporting on errors, or dashboards that show health of systems can all be done in the tool as well. The unique thing that splunk brings to the table is that it can correlate between systems. If you had a Storage device, a server running vSphere, network switches and application logs, it would be possible to see that a disk failure in storage had an effect on the entire stack. This will reduce the time it take for you to find root cause, which ultimatly means you can fix the issue faster.
Is it hard to create dashboards or reports?
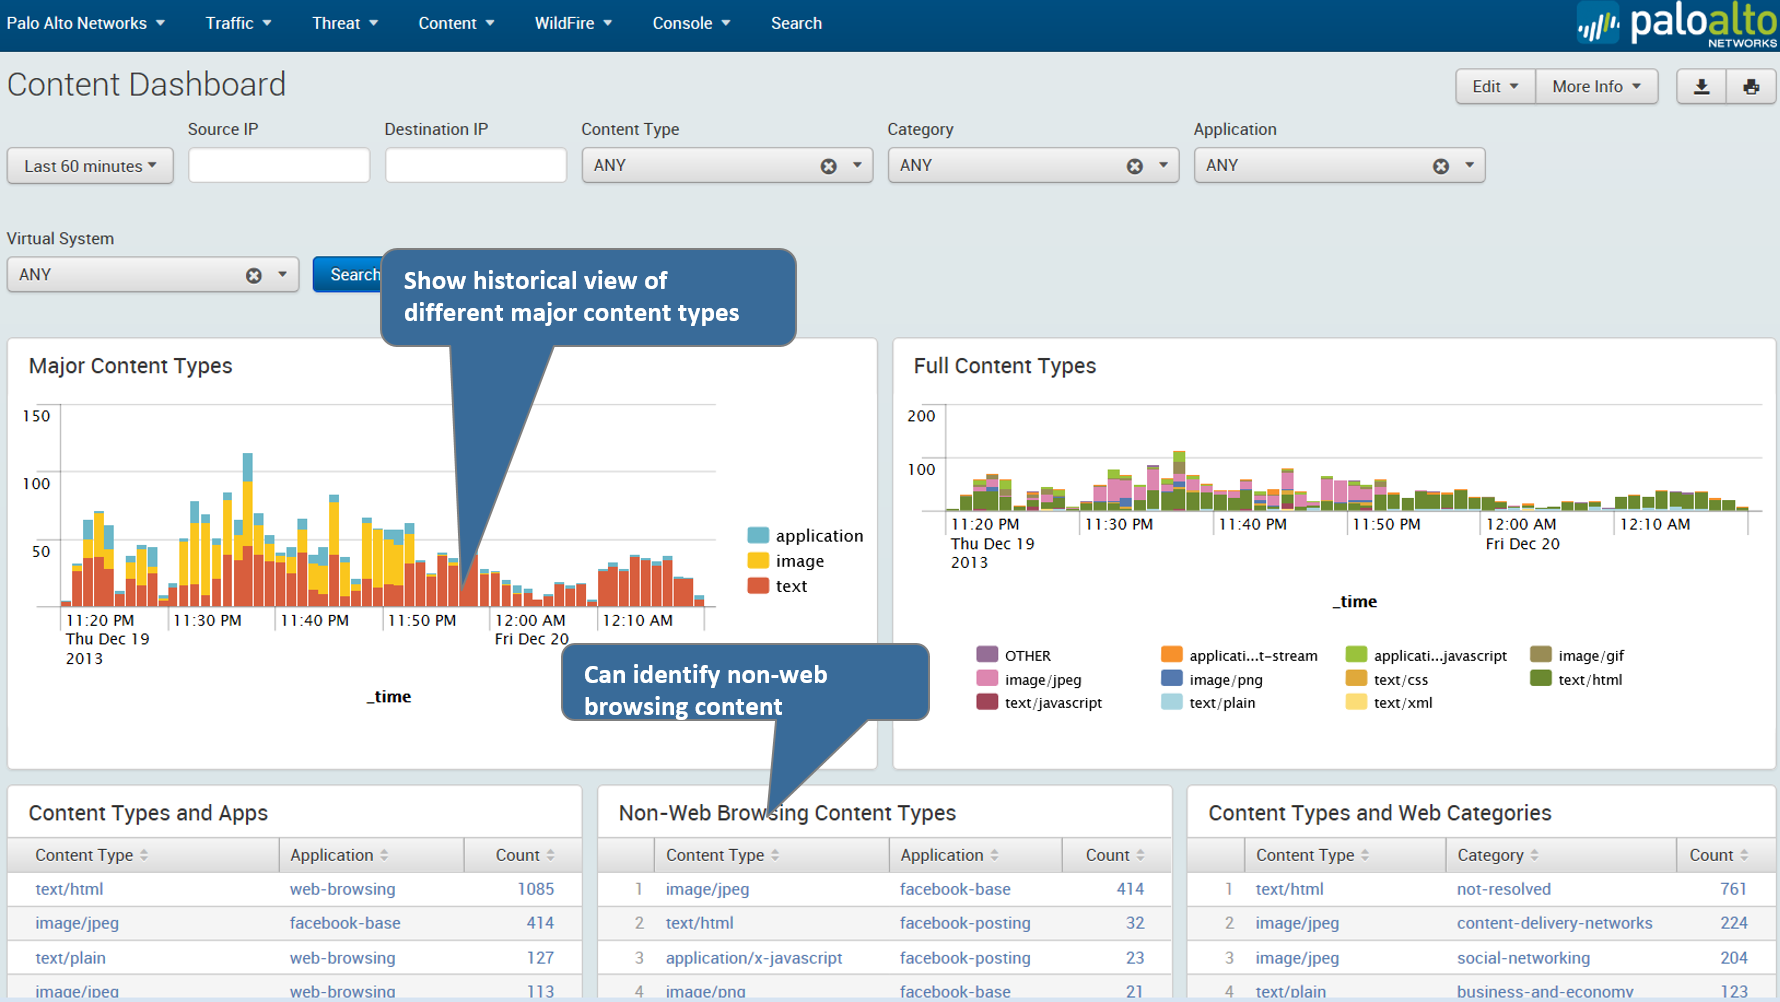
NO! Splunk does have its own language, but it’s very easy to use and learn. I’ve been through a lot of the training and have demo environments setup. It really is like Google for your machine data. The other nice thing is visualizations don’t require a developer to create them. For instance somebody who knows crystal reports. Most visualizations are point and click to create. The other great thing that Splunk has done is they allow partners/vendors to create “apps” which are basically pre-packaged dashboard kits. It has been widely adopted so many of the manufacturers have produced them. Most are free but some are paid for. The VMware vSphere app is paid, but it is very nicely written. Cisco and Palo Alto have them for their security solutions, and they look great. Some people say that Palo’s is the best one in the solution. Below is an example of a dashboard from the Palo Alto App.
What to do next?
If you think this is something you would like to pursue contact your Focus account manager and talk to them about Splunk. We can setup a meeting and discuss what you want to get out of Splunk. If it’s a fit we can move to a pilot phase using the free 60 day trial of Splunk Enterprise. If you like what you see we can assist with the acquisition of the licensing and design a final solution.
Thanks for reading!
Brad Maher |Director of Technology